
Your cart is empty.
Browse plugins
Description
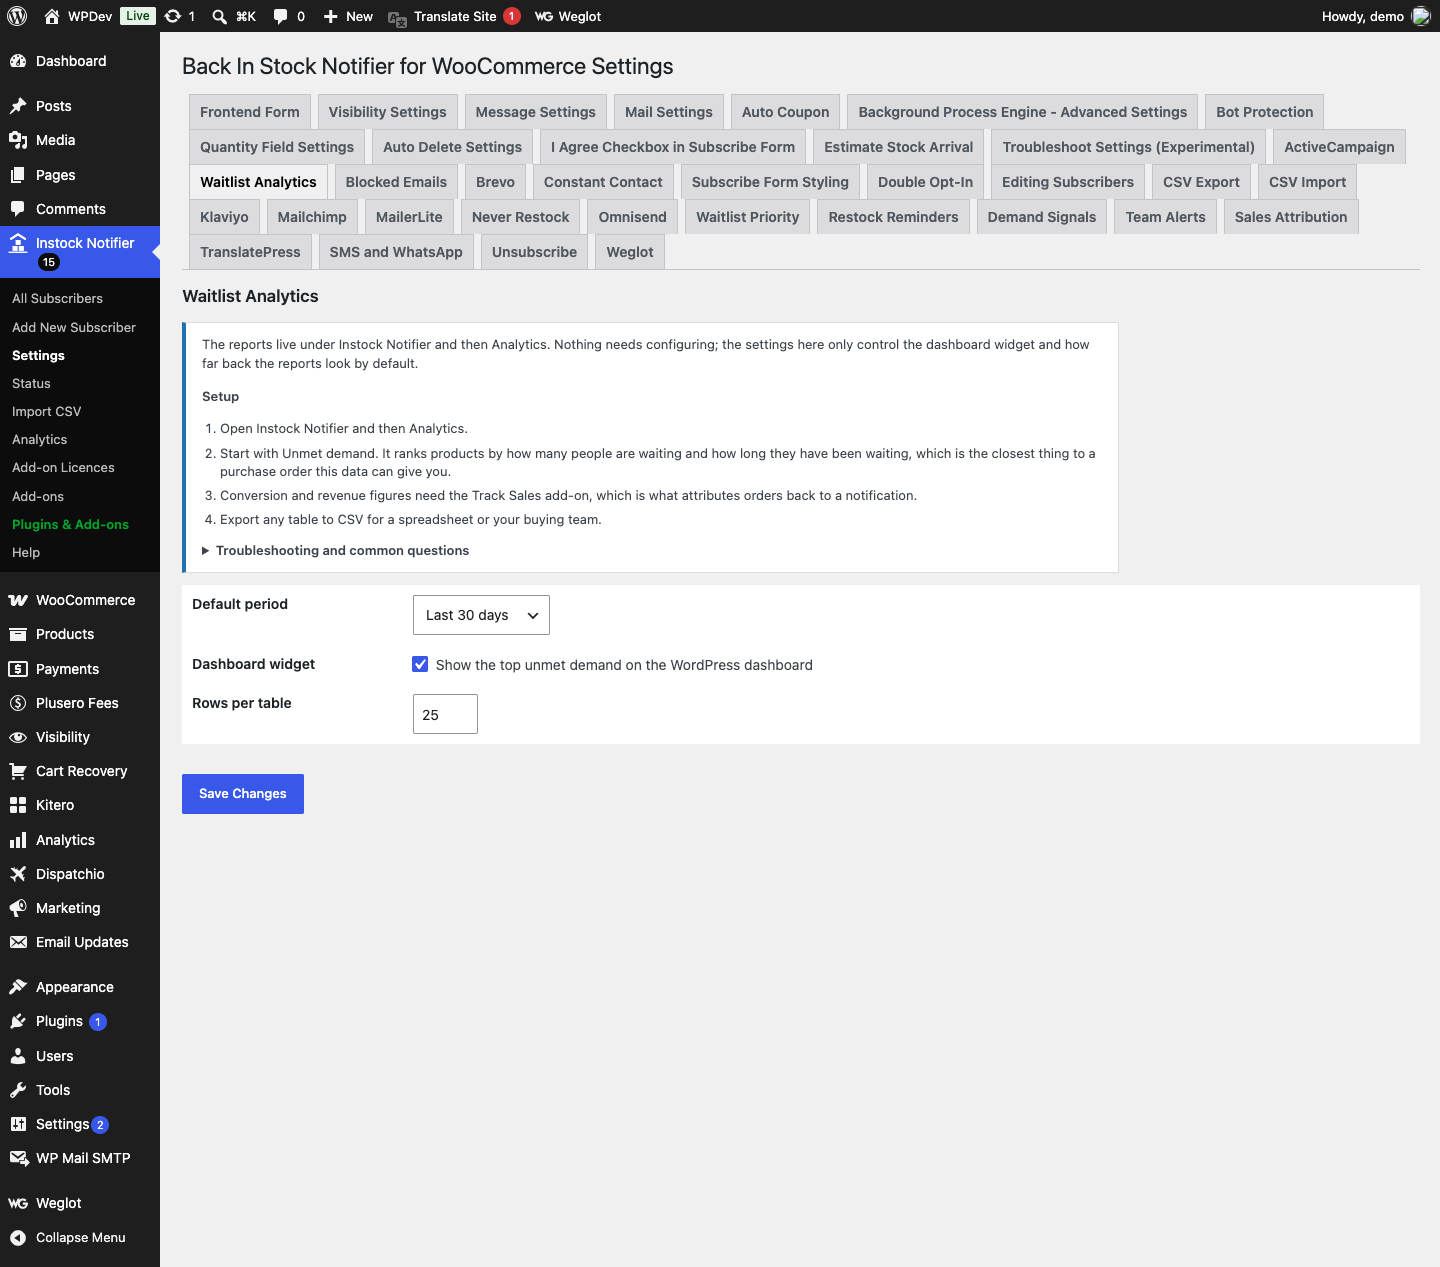
Turn the waitlist into a buying signal: demand ranked by product, conversion and revenue per restock, notification outcomes, signup trend, and a lost-demand report of products nobody has restocked. The reports live under Instock Notifier and then Analytics. Nothing needs configuring; the settings here only control the dashboard widget and how far back the reports look by default.
How it works
- Charts are plain SVG built on the server. No charting library is loaded from a CDN or bundled into the plugin, so the reports screen stays fast and adds no external requests. Every chart is drawn from the same cached figures as the tables below it.
- The trend chart buckets by day for periods up to a month, by week up to four months, and by month beyond that, so the shape stays readable whichever period you pick.
- Notification dates come from the timestamp the parent plugin records when an alert is sent, not from when the row was last edited, so the notifications line reflects what actually went out.
- Signups in period are counted by the date somebody joined a waitlist. Notified, Converted and Attributed revenue are counted by the date the restock alert was sent, so they answer “what did the alerts I sent in this period achieve” rather than “what happened to people who happened to join in this period”.
- Every figure is computed with grouped SQL against the post meta table rather than by loading subscriber objects. On a waitlist of any size that is the difference between a report that renders and one that times out.
- Reports are cached for fifteen minutes. Invalidation bumps a counter folded into every cache key rather than deleting rows, because a LIKE delete against the options table on every new signup would slow the subscribe form during exactly the restock you are trying to measure.
- Unmet demand is the report to start with. It ranks products by how many people are waiting and how long they have waited, which is the closest this data gets to a purchase order.
Setting it up
- Open Instock Notifier and then Analytics.
- Start with Unmet demand. It ranks products by how many people are waiting and how long they have been waiting, which is the closest thing to a purchase order this data can give you.
- Conversion and revenue figures need the Track Sales add-on, which is what attributes orders back to a notification.
- Export any table to CSV for a spreadsheet or your buying team.
Common questions
Why is the notifications line flat at zero? No restock alerts have been sent in the selected period. If you know alerts have gone out, they predate this period, so widen it. Entries notified by very old versions of the parent plugin may also have no send timestamp recorded.
Can I hover a chart to read exact numbers? Yes. Every point and every segment carries a native tooltip, so the figures are readable without any JavaScript running on the page. The tables underneath carry the same data in full.
Why is revenue empty? Revenue comes from the Track Sales add-on. Without it there is no link between an order and the notification that caused it, so there is nothing honest to report.
Conversion rate looks low. Ten to thirty percent is a normal band for restock alerts, which is very high by email standards. If yours is far below that, look at how quickly the alert goes out after the restock: minutes convert, hours do not.
The numbers are a few minutes old. Reports are cached for fifteen minutes so opening the screen does not run heavy queries every time. Use Refresh on the report page to recompute immediately.
Can I see this in WooCommerce Analytics? Not directly. Export the CSV if you want to combine it with your other reporting.
Data and privacy
- Nothing is stored beyond cached report output, and nothing is sent anywhere.
- CSV exports of these reports contain product names and counts, not subscriber addresses.
Additional information
| License | Starter License, Growth License, Ultimate License |
|---|
Related products

Back In stock Notifier for WooCommerce: Add-ons
Klaviyo - Back In Stock Notifier for WooCommerce
From
$19.00
One-time

Back In stock Notifier for WooCommerce: Add-ons
Export CSV Add-on - Back In Stock Notifier for WooCommerce
From
$19.00
One-time

Back In stock Notifier for WooCommerce: Add-ons
Import CSV Add-on - Back In Stock Notifier for WooCommerce
From
$19.00
One-time